This manual is for PSYC FPX 3700 Assessment 2, start to submission. The middle deliverable in a statistics course usually adds a third group, which changes the arithmetic very little and the writing a great deal: one overall test tells you that a difference exists somewhere among the means, and only a follow-up comparison can say which pair it sits between. More marks are lost on that single point in this course than on any other, because a sentence naming the best group on the strength of the overall test alone is unsupported no matter how true it happens to be. What follows is the method, a structure the criteria can be read against, an annotated model excerpt, and the checklist we run before delivery. Want it handled? A premium original sample arrives in 24 to 48 hours, revised at no charge until the guide is met. Capella's catalog lists the course as PSYC-FPX3700, and some courserooms print PSYC3700; both point to this same Assessment 2.
One honesty note before the manual: Capella revises courses and scoring guides over time, so always write to the exact scoring guide attached to your assessment in the courseroom. The course identity above is verified on capella.edu; the method and structure below are our tutors' approach to it, not Capella's official rubric text.
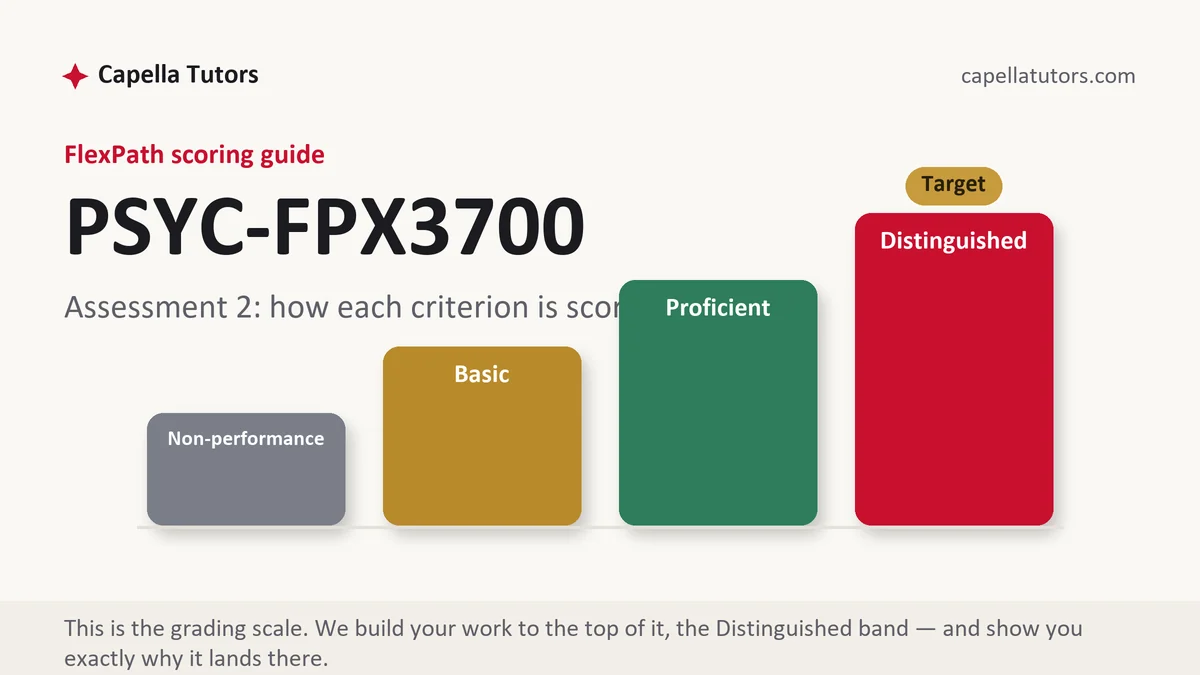
How PSYC FPX 3700 Assessment 2 is scored
Four levels, one verdict per criterion. Treat the descriptions as a specification rather than as feedback:
| Level | What it means on a three-group comparison |
|---|---|
| Distinguished | The overall test is reported with its two degrees of freedom, the follow-up comparisons are corrected for multiple testing and reported in full, a proportion-of-variance effect size appears, and the conclusion names only the pairs the follow-ups support. |
| Proficient | The overall test and the follow-ups are all present and correct, but the interpretation stays inside the statistics instead of reaching the reader's units. |
| Basic | One significant overall result, then a conclusion about which group did best that no reported comparison actually supports. |
| Non-performance | No follow-up comparisons at all, no effect size, or a conclusion that contradicts the numbers in the table. |
One detail evaluators check quietly. The two numbers in parentheses after the overall statistic let a reader reconstruct how many groups you compared and how many people were in the study, so if they do not match your own descriptive table, every criterion in the paper starts to look approximate.
The PSYC FPX 3700 Assessment 2 method, step by step
-
Write the group sizes on paper first
Three groups means three counts, three means, and three standard deviations, and unequal group sizes are normal in real data. Having them written down is what lets you notice later that your degrees of freedom, your table, and your narrative all describe the same study.
-
State what the overall test can and cannot say
Put one sentence in the paper saying that the overall test asks whether the three population means are all equal, and nothing more. Writing the limit yourself is the cheapest way to demonstrate you understand it, and it protects you from the sentence that would otherwise have cost the interpretation criterion.
-
Run corrected follow-up comparisons and report all of them
Three groups produce three pairwise comparisons, and testing three times at the usual cutoff finds a difference by accident more often than the cutoff advertises. Use the correction your course specifies, then report each comparison with its mean difference, its adjusted p, and its interval, including the ones that came back unremarkable.
-
Add the effect size the overall test takes
An analysis of variance takes a proportion-of-variance measure, and the number answers a different question from the p value: how much of the variation in scores travels with group membership. A value near .11 means about eleven percent, which is worth having in words as well as in symbols.
-
Translate the difference into the original units
Three and a half points on a forty-item vocabulary test is a translation a reader can act on; a standardized value of .45 is not, until you say what it means here. The benchmarks for small, medium, and large were offered as loose conventions by their author rather than as thresholds, so compare your value with what studies in the same area usually find.
-
Check assumptions, then self-score against every criterion
Independence first, then the shape of the residuals rather than the raw scores, then whether the spreads are similar enough, with the adjusted version of the test used and named if they are not. Then grade your own draft, criterion by criterion, and repair anything sitting below the top level.
A structure that maps to the criteria
Our planning lengths for a three-group report, not Capella requirements; the follow-up and interpretation rows are where extra words earn their keep.
| Section | What it must do | Guide |
|---|---|---|
| Design and variables | The grouping variable with its levels, the outcome with its scoring, and how people reached each group. | ~200 words |
| Hypotheses | The equality of all three population means as the null, with the alternative stated properly rather than as a guess about winners. | ~150 words |
| Descriptives and checks | Three counts, means, and standard deviations, plus independence, shape, and spread with your response to each. | ~300 words |
| The overall test | Statistic, both degrees of freedom, exact p, and the proportion-of-variance effect size. | ~200 words |
| Follow-up comparisons | Every pair reported with mean difference, adjusted p, and interval, including the unremarkable ones. | ~300 words |
| Interpretation and references | The supported claims in the units of the measure, what stays unknown, and current APA both ways. | ~250 words |
Annotated sample excerpt
A model paragraph written by our team, at the register the Distinguished column describes, showing how far a conclusion may and may not go.
Post-test vocabulary scores differed across the three feedback formats, F(2, 75) = 4.61, p = .013, and about eleven percent of the variation in scores travelled with which format a student received, eta squared = .11.1 That result says only that the three population means are unlikely to be identical, so the corrected comparisons carry the conclusion: recorded audio feedback beat score-only feedback by 3.4 points on the 40-item test, adjusted p = .011, 95% CI [0.8, 6.0], while written comments beat score-only by 1.9 points, adjusted p = .21, 95% CI [-1.2, 5.0], and audio and written did not separate.2 Stated for the tutoring coordinator who has to choose, the defensible claim is that audio feedback is worth about three or four extra correct items compared with a bare score, and that the case for written comments over a bare score is not yet made.3
- 1The overall test with both degrees of freedom, the exact p, and the effect size given in words before the symbol. A reader can now reconstruct three groups and 78 students.
- 2Every comparison reported, including the one that failed and the one that was never significant, with intervals. The interval crossing zero explains the adjusted p rather than repeating it.
- 3Translates the surviving finding into items on the test and names what remains unsupported. This is the sentence the practical significance criterion is asking for.
The full premium sample for your exact assessment, written fresh to your scoring guide and issue, is free to request. Study it, revise it into your own voice, and submit work you understand.
The five mistakes that cost Distinguished
- Naming the best group from the overall test. It reports that a difference exists somewhere; only a corrected comparison can identify the pair.
- Reporting only the comparisons that worked. Selective reporting changes what the numbers mean, and the guide treats the missing pairs as missing elements.
- No effect size for the overall test. Significance without a proportion of variance leaves the reader unable to judge whether any of it matters.
- Turning an unremarkable comparison into proof of no difference. Failing to detect a difference is not evidence of equality, and the interval shows what you could not rule out.
- Degrees of freedom that contradict the table. Those two numbers describe your design, and a mismatch reads as carelessness across every criterion.
Pre-submission checklist
- Three counts, three means, and three standard deviations reported before any test
- One sentence stating what the overall test can and cannot establish
- All three pairwise comparisons reported with adjusted p values and intervals
- A proportion-of-variance effect size, given in words as well as symbols
- The surviving difference translated into the units of the measure
- Degrees of freedom consistent with the table, and current APA both ways
Three groups and one week left?
Send the prompt, the data set, and the software your section requires. We will run the analysis, correct the follow-ups, build the tables in APA form, and write the paragraph that says what a coordinator should do about it. The first premium sample costs nothing.