This manual is for PSYC FPX 3700 Assessment 1, start to submission. The first graded deliverable in a statistics course is normally the one that asks you to describe a data set and compare two groups in it, then say what the comparison means to somebody who does not read output. The software does the arithmetic; the criteria are about the four judgments around it, which are choosing the procedure, checking what it assumes, pulling the right numbers out, and writing the sentence at the end. Below is the method our tutors use, a structure the criteria can be graded against, and an annotated excerpt from an original model report. Rather not do it alone? Send the data and the guide and a premium original sample comes back in 24 to 48 hours with every figure checked twice, revised free until it scores. Capella's catalog lists the course as PSYC-FPX3700, and some courserooms print PSYC3700; both point to this same Assessment 1.
One honesty note before the manual: Capella revises courses and scoring guides over time, so always write to the exact scoring guide attached to your assessment in the courseroom. The course identity above is verified on capella.edu; the method and structure below are our tutors' approach to it, not Capella's official rubric text.
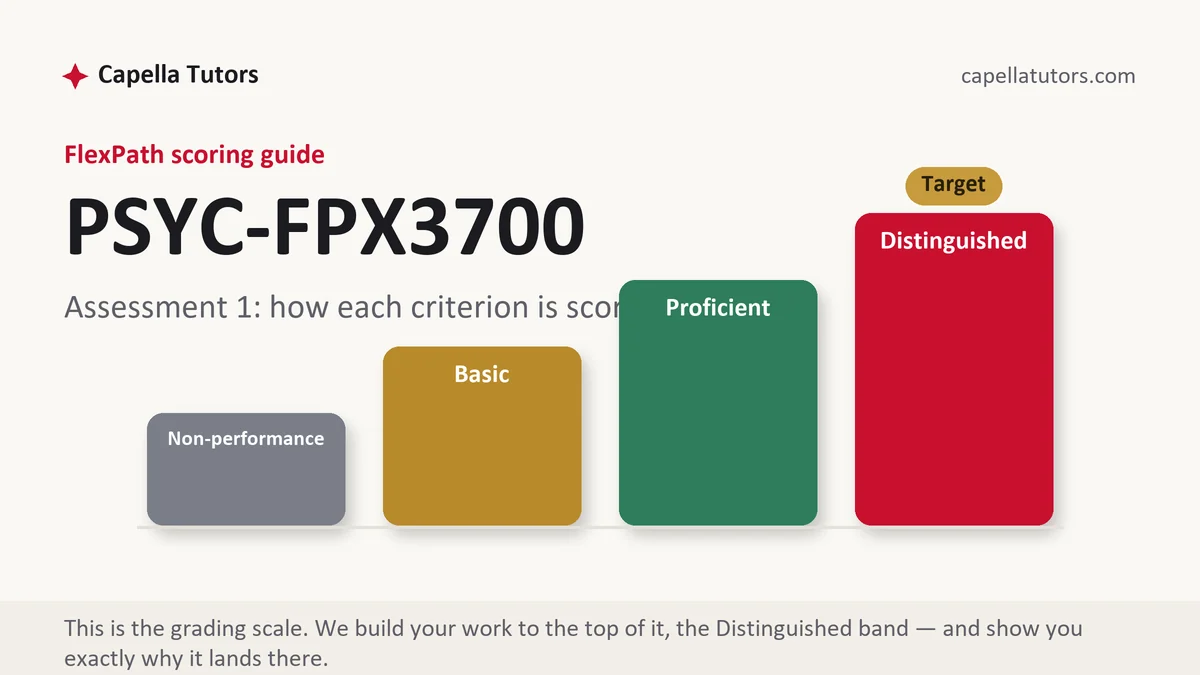
How PSYC FPX 3700 Assessment 1 is scored
There is no letter grade and no partial credit for effort. Every criterion lands at one of four levels, and the level wording tells you which sentence is missing:
| Level | What it means on a data analysis report |
|---|---|
| Distinguished | The procedure is justified from how the variables were measured, the assumption checks have consequences attached, the result is reported complete with an effect size and an interval, and the interpretation is written in the units a reader cares about. The extra clause is usually the interpretation; do not leave it as a restatement of the p value. |
| Proficient | The right test, correctly run and correctly reported. What is thin is the meaning, so the paper explains the output rather than the finding. |
| Basic | Software output pasted or paraphrased, significance announced, and nothing said about size or spread. The most common first submission in this course. |
| Non-performance | A required element is absent, most often the descriptive statistics, the assumption checks, or an interpretation of any kind. |
Undergraduate statistics is graded on interpretation more than on calculation, which is good news if arithmetic worries you and bad news if you were hoping the numbers would speak for themselves. A number in a psychology paper is never the finding. The finding is the sentence a reader could repeat to somebody else without opening the table.
The PSYC FPX 3700 Assessment 1 method, step by step
-
Read the scoring guide with the data file open
Match each criterion to the part of the output that will answer it, and note which criteria are about the analysis and which are about writing. In a statistics course they are graded separately, so a perfect analysis reported badly loses marks in two places rather than one.
-
Describe before you test
Write down the number of cases in each group, each mean, and each standard deviation before you run anything. Those figures go into your final sentence, they tell you whether anything odd sits at the edge of the range, and half the reporting errors in this course come from a writer who never wrote them down.
-
Ask what a mean alone is hiding
Two groups with means of 312 and 278 sound clearly different until you notice both standard deviations are near 40, at which point you know a large share of the slower group scored faster than a large share of the quicker group. A mean without a spread hides overlap, and overlap is what a reader needs in order to know whether the difference would show up in any one person.
-
Justify the procedure from the measurement
Say what each variable is and how it was scored, then let that choose the test rather than choosing the test first. Two independent groups on a continuous outcome point at one procedure, the same people measured twice point at another, and writing that reasoning in one sentence is worth a criterion by itself.
-
Check the assumptions and act on what you find
Independence is a question about how the data were collected, not something a test can rescue. Look at the shape of the scores rather than trusting a significance test of normality, which rejects trivial departures once the sample is reasonably large. Where the spreads differ, use the adjusted version of the comparison and say in the paper that you did, and why.
-
Write the plain sentence first, then hang the numbers on it
Draft the finding in words with no symbols at all, get it accurate, and only then insert the statistics in APA order. Doing it the other way round produces the paragraph that reports p and stops, which is the paragraph that caps a criterion at Basic.
A structure that maps to the criteria
Word counts here are our planning targets for a report of this size rather than Capella instructions, and the interpretation row is the one to expand if your guide gives it a criterion of its own.
| Section | What it must do | Guide |
|---|---|---|
| Variables and measurement | Each variable named, how it was scored, and what kind of number it produces. | ~150 words |
| Hypotheses | Null and alternative written about the population, with a direction if you have grounds for one. | ~150 words |
| Descriptive statistics | Cases per group, means, standard deviations, and one sentence on what the spread implies. | ~250 words |
| Assumption checks | Independence, distribution shape, and spread, each with what you looked at and what you did about it. | ~250 words |
| Results | The comparison in APA order: statistic, degrees of freedom, exact p, effect size, interval. | ~250 words |
| Interpretation and references | The finding in the original units, what the design cannot support, and current APA both ways. | ~300 words |
Annotated sample excerpt
An original model paragraph from our team, showing the order the top of the guide expects: the claim in English, then the numbers that license it.
Volunteers who reported sleeping under six hours the previous night pressed the key more slowly than those reporting seven hours or more, by about 34 milliseconds on average (M = 312, SD = 41 and M = 278, SD = 38 respectively), t(58) = 3.32, p = .002, d = 0.86, 95% CI [13.5, 54.5].1 The interval is worth reading before the p value, because it says the difference in the population is probably somewhere between a barely noticeable 14 milliseconds and a substantial 55, which is a wide range and an honest one for 30 people per group.2 Two further limits belong in the same paragraph rather than in a closing apology: the standard deviations near 40 mean many short-sleep volunteers responded faster than many long-sleep volunteers, and because people sorted themselves into these groups by how they slept, nothing here shows that sleeping less caused the slowing.3
- 1Plain claim with a direction and a real-world quantity first, then the descriptives, then the test in APA order. Symbols are italicized, p is exact, and the value that cannot exceed one keeps no leading zero.
- 2Reads the interval as a range of plausible truths rather than as decoration. This is the sentence that separates an interpretation criterion from a results criterion.
- 3Names what the spread hides and what the design cannot support, in the results paragraph where an evaluator is looking, not in a limitations section at the end.
The full premium sample for your exact assessment, written fresh to your scoring guide and issue, is free to request. Study it, revise it into your own voice, and submit work you understand.
The five mistakes that cost Distinguished
- Writing p = .000. A probability is never zero; the output has rounded, and the correct report is that p is below .001.
- Means with no spread. Two averages without their standard deviations hide how much the groups overlap, which is the first thing a reader needs.
- Significance treated as size. A tiny p in a large sample can sit beside a difference nobody would notice, so the effect size and the interval belong in the same sentence.
- Causal verbs on a comparison of self-sorted groups. Caused, improved, and reduced are experimental words, and using them where nothing was assigned costs the interpretation criterion.
- Pasted output as the results section. Build the APA table yourself and send the raw output to an appendix if the guide wants it at all.
Pre-submission checklist
- Cases per group, means, and standard deviations all appear before the test
- The procedure justified from how the variables were measured
- Assumption checks reported with what you did in response to each
- Statistic, degrees of freedom, exact p, effect size, and interval, in APA order
- The finding written once in plain words, in the units of the measure
- No causal language without assignment, and every table figure matching the narrative
Data file open and going nowhere?
Send the prompt, the data, and whatever output you already produced. We will choose the procedure, check the assumptions, format the tables, and write the interpretation in the units of your measure. One reader on our team does nothing but confirm the narrative matches the table. First premium sample free.