This manual is for PSYC FPX 2600 Assessment 3, start to submission. Assessment 3 in this course is usually the one that asks you to follow something across time rather than to explain one moment, and it is where the criteria start grading how you report evidence. If the assessment sends you to an inventory result, a longitudinal claim or a set of age differences, the writing standard changes: sizes with intervals, designs named, and causal language kept where the evidence can carry it. Below is the method our tutors use for it, a structure that keeps the reporting honest, and an annotated excerpt from an original model. Prefer to hand it off? Send the material and the guide and a premium original sample comes back in 24 to 48 hours. Capella's catalog lists the course as PSYC-FPX2600, and some courserooms print PSYC2600; both point to this same Assessment 3. In current courserooms this assessment typically appears as "Developmental Perspectives in Lifespan Psychology".
One honesty note before the manual: Capella revises courses and scoring guides over time, so always write to the exact scoring guide attached to your assessment in the courseroom. The course identity above is verified on capella.edu; the method and structure below are our tutors' approach to it, not Capella's official rubric text.
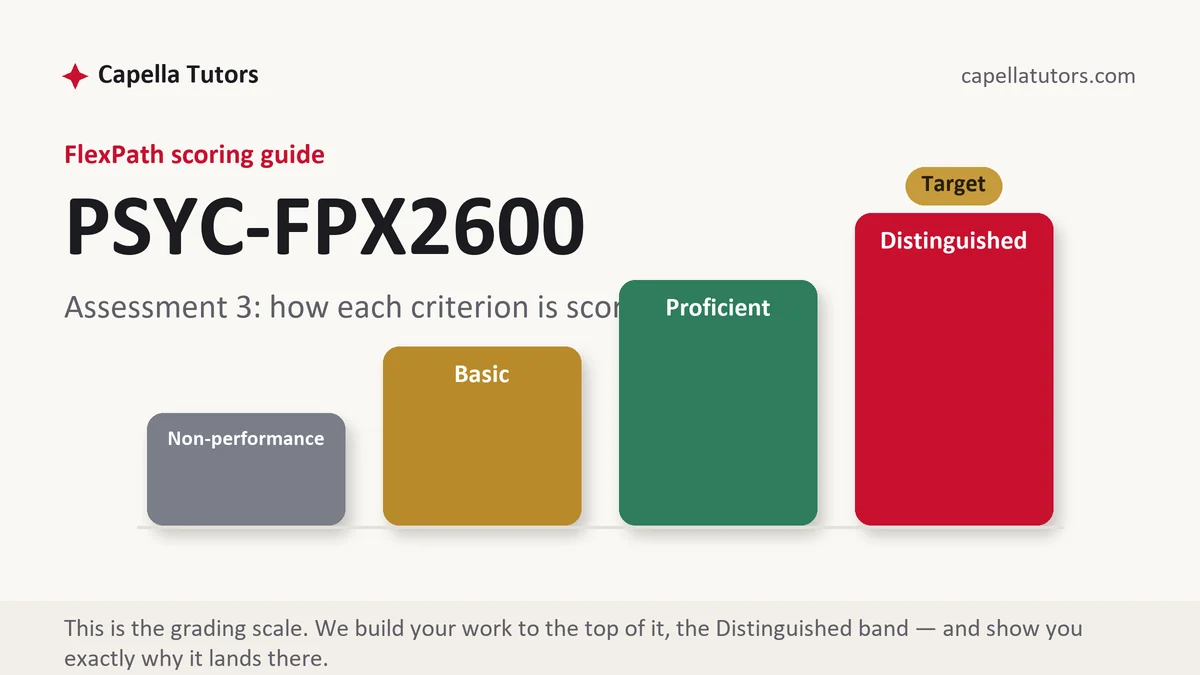
How PSYC FPX 2600 Assessment 3 is scored
There are four columns and one grade per criterion, and in this assessment the evidence rows decide the outcome:
| Level | What it means on a change-over-time paper |
|---|---|
| Distinguished | Change is reported with its size and an interval around it, the design behind each finding is named with the threat it carries, and stability and change are kept distinct rather than merged. The row usually asks you to evaluate the evidence, which means saying what it cannot show. |
| Proficient | The findings reported accurately and applied to the case, with sizes given but not qualified. Correct, and short of the row that asks how much confidence the numbers support. |
| Basic | Scores read as labels and differences read as change, with a significant result treated as a large one. |
| Non-performance | A required element is absent, most often the research base or any acknowledgment of what a single result cannot establish. |
One habit carries most of this assessment: every number gets a size, a denominator and a window. A finding written as significant and left there tells a reader nothing about how big it is or how well it would repeat.
The PSYC FPX 2600 Assessment 3 method, step by step
-
Separate the score from the trait
An inventory produces an estimate of where a person sits relative to a comparison sample, not a fact about who they are. Say which inventory, where the norms come from, and how wide the band around a single score is, then write the interpretation comparatively: higher than most of the comparison group rather than high.
-
Distinguish the two kinds of change before you write either
Rank order stability asks whether people keep their positions relative to each other, and mean level change asks whether a whole group drifts with age. Adult personality research reports substantial rank order stability alongside gradual mean level movement, and a paper that runs the two together will contradict itself inside one paragraph.
-
Report every size with an interval around it
A stability correlation of about .6 across a decade is a different claim from a point estimate reported bare, and a confidence interval is what tells a reader how much room the estimate leaves. Write both numbers, in your own sentence, from the study you actually read.
-
Name the design and the threat it carries
A cross-sectional comparison of thirty year olds and seventy year olds tangles age with everything separating those birth cohorts, including schooling, test familiarity and health care. A longitudinal design separates them and pays twice, because the people who stay are healthier and more motivated than those who leave, and repeated testing teaches the test. Put the design in the citation sentence and the threat beside it.
-
Say what the p value cannot say
A p value reports how surprising the data would be if there were nothing to find. It does not report the size of a change, the probability that your explanation is right, or whether the result would appear again, and in a large sample a difference too small to matter clears the threshold easily. Write the effect size, then the interval, then the significance, in that order of importance.
-
Keep the case and the literature in separate sentences
Two administrations of an inventory eight years apart is one person measured twice, so the honest sentences are about association and consistency: the second profile sits inside the range the stability literature reports, this pattern is consistent with the drift the field describes. Reserve any causal claim for evidence that could support it, and say plainly what a single case cannot establish.
A structure that maps to the criteria
Word targets below are our tutors' planning figures for a paper of this kind, not a Capella requirement; expand any section your scoring guide weights.
| Section | What it must do | Guide |
|---|---|---|
| The person and the material | Age, context, which instrument or record you are working from, and what was collected when. | ~200 words |
| What the scores say | The profile in comparative language, with the norm sample and the band around each score named. | ~250 words |
| Stability and change in the literature | Rank order and mean level findings reported separately, each with a size and an interval. | ~300 words |
| Designs and their threats | Which design produced each finding and the specific limit it carries, in your own sentences. | ~250 words |
| The case against the literature | How this person's pattern sits relative to the research, in association language, with the limits of one case. | ~200 words |
| Ethics and references | Consent and confidentiality for a real person's results, current APA matched both ways. | ~120 words |
Annotated sample excerpt
An original model excerpt from our team, written to show how a number is reported when the evidence row is watching. Take the habits and apply them to your own material.
The subject, a woman of forty three, completed the same five factor inventory twice for an employer, eight years apart, and her conscientiousness estimate rose while her ordering relative to the norm sample barely moved.1 That pattern is what the adult literature describes rather than an anomaly: rank order stability across a decade in adulthood is reported at around .6, with confidence intervals wide enough that a single pair of scores cannot be placed precisely inside it, while mean level movement on this trait across the same span is small and gradual.2 Both figures come from longitudinal samples, which separates age from cohort at the cost of selective retention, since the participants who complete a second administration are systematically healthier and more engaged, and none of it licenses a claim that anything in these eight years produced the change in one person measured twice.3
- 1Reports the two administrations and the window between them, and describes the score as an estimate and an ordering rather than as a property of the person.
- 2Gives the size and says the interval is wide, and keeps rank order stability and mean level change in separate clauses so that neither is mistaken for the other.
- 3Names the design, states the specific threat it carries, and refuses the causal sentence a reader would otherwise supply.
The full premium sample for your exact assessment, written fresh to your scoring guide and issue, is free to request. Study it, revise it into your own voice, and submit work you understand.
The five mistakes that cost Distinguished
- A score read as a label. An inventory estimates a position against a comparison sample, and the band around a single administration is wider than most papers admit.
- Stability and change merged. People can keep their relative order while a whole group drifts, and a paper that mixes the two will argue against itself.
- Significant reported as large. A p value cannot tell a reader how big anything is, and in a big sample a trivial difference clears the threshold.
- Age differences called aging. A cross-sectional gap contains everything else that separates two birth cohorts, and the design has to be named.
- One case turned into a finding. Two administrations of one inventory support a description, an association at most, and never a cause.
Pre-submission checklist
- The instrument, its norm sample and the band around each score are named
- Rank order stability and mean level change reported separately
- Every size reported with an interval, taken from the study you read
- The design named in the citation sentence with the threat it carries beside it
- Effect size before significance, and what the p value cannot say stated once
- Association language for the case, with consent and confidentiality handled
Evidence rows worrying you?
Send the material and the scoring guide. Our research analyst pulls the studies, the writer reports each size with its interval and its design, and the premium original sample lands in 24 to 48 hours with free revisions until the evaluation rows clear.