This manual is for NURS FPX 8024 Assessment 1, start to submission. In current courserooms, Assessment 1 of Advanced Global Population Health examines how nongovernmental organizations contribute to global health: you choose a global health issue, describe the NGOs working on it, analyze their interventions, partnerships, funding and measurable impact, weigh their limits, and draw implications for nurse leaders. The grade turns on evidence of impact. A description of an NGO's mission scores lower than an analysis of what its programs changed, for whom, and how we know. Below is the method our tutors use, a structure that maps to the criteria, and an annotated sample excerpt. Prefer to hand it off? A premium original sample for this exact assessment comes back in 24 to 48 hours, revised free until it meets the guide. Capella's catalog lists the course as NURS-FPX8024, and some courserooms print NURS8024; both point to this same Assessment 1. In current courserooms this assessment typically appears as "Role of NGOs in Global Health Issues".
One honesty note before the manual: Capella revises courses and scoring guides over time, so always write to the exact scoring guide attached to your assessment in the courseroom. The course identity above is verified on capella.edu; the method and structure below are our tutors' approach to it, not Capella's official rubric text.
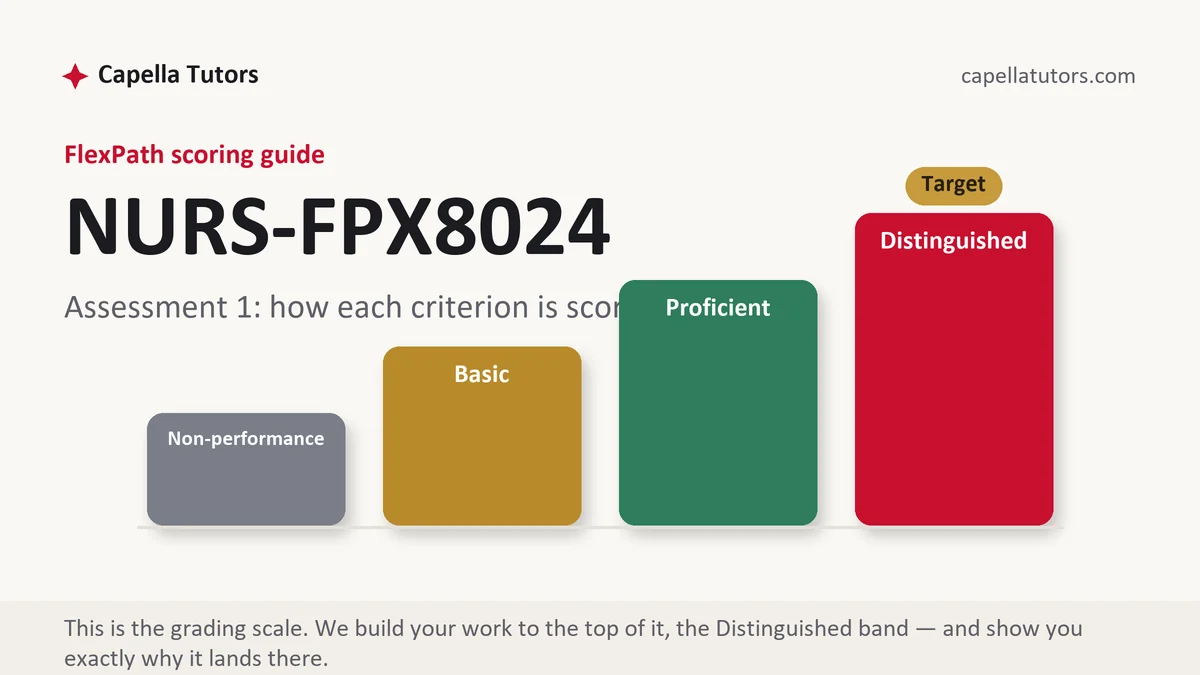
How NURS FPX 8024 Assessment 1 is scored
FlexPath does not use letter grades. Each criterion in the scoring guide lands on one of four levels, and the level descriptions are the real writing brief:
| Level | What it means on an NGO and global health paper |
|---|---|
| Distinguished | The global health issue is described with WHO or similar data, the NGOs and their interventions are analyzed with evidence of outcomes, partnerships with governments and agencies are explained, limits such as sustainability and accountability are weighed, and implications for nurse leaders are specific. |
| Proficient | The issue and the NGOs are described accurately, but impact is asserted more than shown. |
| Basic | The paper describes NGO missions with little analysis of results. |
| Non-performance | The issue, the impact analysis or the implications are missing. |
Choose an issue where NGO work is documented, such as maternal mortality, HIV, malaria or tuberculosis, so that impact can be shown with data.
The NURS FPX 8024 Assessment 1 method, step by step
-
Define the issue with data
Burden, distribution and trend from WHO, UNICEF or Global Burden of Disease sources.
-
Identify the NGOs
Two or three organizations working on the issue, with their scope and funding.
-
Analyze their interventions
What they deliver, where and to whom, and how it fits the health system.
-
Show impact with evidence
Program evaluations or studies reporting measurable change.
-
Weigh the limits
Dependence on donors, coordination with governments, accountability and sustainability.
-
Draw implications for nurse leaders
What doctoral nurses can apply in their own institutions or partnerships.
A structure that maps to the criteria
Word counts are planning targets our tutors use for this paper, not Capella rules; follow the length your scoring guide states.
| Section | What it must do | Guide |
|---|---|---|
| Introduction | The global health issue and why NGOs matter to it. | ~150 words |
| The issue | Burden and determinants with data. | ~250 words |
| NGOs and their interventions | Who they are and what they deliver. | ~300 words |
| Impact and limits | Evidence of outcomes and the constraints on NGO work. | ~300 words |
| Implications and references | Lessons for nurse leaders, then current APA. | ~150 words |
Annotated sample excerpt
An original model excerpt from our team, written to show the register that reaches the top of the guide. Learn the moves, then write your own version.
Community health worker programs run by NGOs in several sub-Saharan African countries have been associated with higher rates of facility births and postnatal visits in the districts they serve, according to program evaluations published over the past decade.1 The same evaluations show the limit of the model: where funding ended and health ministries did not absorb the workers into public payrolls, visit rates fell back within two years.2 For nurse leaders, the lesson is that an NGO program's design should include its transition to public or institutional ownership from the start, which is the same sustainability question a DNP project faces at its own site.3
- 1Reports impact as measured change, with its source.
- 2Shows a real limit of NGO work with evidence.
- 3Turns the analysis into a specific implication for nurse leaders.
The full premium sample for your exact assessment, written fresh to your scoring guide and topic, is free to request. Study it, revise it into your own voice, and submit work you understand.
The five mistakes that cost Distinguished
- Mission statements instead of results. Show what the NGO's programs changed.
- An issue without data. Use WHO or similar sources for burden.
- No limits discussed. Sustainability and accountability belong in the analysis.
- Implications that are generic. Say what a nurse leader would do differently.
- Outdated figures. Use the most recent global data available.
Pre-submission checklist
- Global health issue defined with current data
- NGOs and their interventions described
- Impact supported by evaluations or studies
- Limits such as sustainability weighed
- Specific implications for nurse leaders
- Current APA references
Want the NGO paper written?
Send the scoring guide and the issue you chose. Our team returns a premium original paper in 24 to 48 hours, revised free until it meets the guide.