This manual is for NURS FPX 6222 Assessment 4, start to submission. This deliverable in NURS FPX 6222 usually widens the frame from one process to the organization's use of its own data. Your scoring guide decides the shape, and the assessment typically asks you to examine the outcome measures a setting relies on, identify the issues those measures reveal or conceal, and set out the opportunities that follow. Some guides pair it with a conversation with a quality leader. The graded skill is interpretive discipline: knowing what a measure can support, what it cannot, and where a difference between groups is a finding rather than an artifact. Below is the method, a criterion-mapped structure, and an annotated excerpt. Prefer it drafted for you? A premium original sample arrives in 24 to 48 hours, revised free until the guide is satisfied. Capella's catalog lists the course as NURS-FPX6222, and some courserooms print NURS6222; both point to this same Assessment 4. In current courserooms this assessment typically appears as "Outcome Measures, Issues, and Opportunities Presentation".
One honesty note before the manual: Capella revises courses and scoring guides over time, so always write to the exact scoring guide attached to your assessment in the courseroom. The course identity above is verified on capella.edu; the method and structure below are our tutors' approach to it, not Capella's official rubric text.
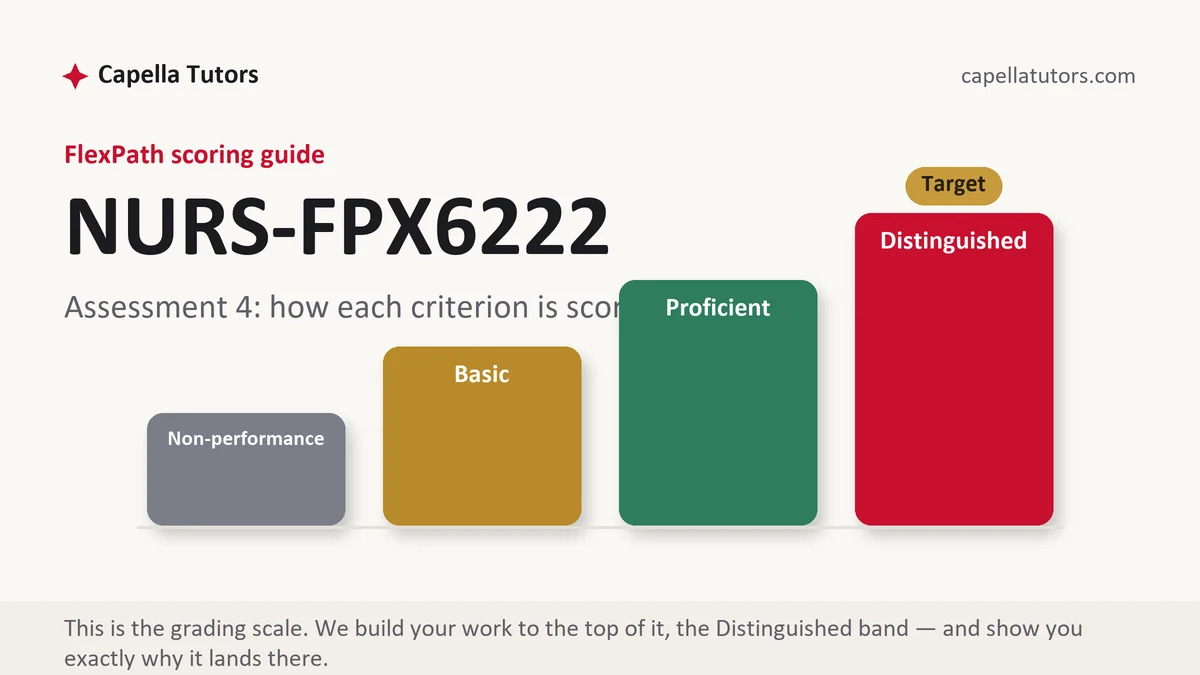
How NURS FPX 6222 Assessment 4 is scored
Every criterion is judged on its own against four levels, and on an analysis of measures the levels sort interpretation from reporting:
| Level | What it means on an analysis of outcome measures |
|---|---|
| Distinguished | Each measure is interrogated before it is used: definition, risk adjustment, reporting lag, and sample size are stated, differences are tested against the obvious confounders, and the opportunities that follow are ranked by what the data can actually support. |
| Proficient | A complete, accurate reading of the organization's measures with reasonable opportunities drawn from them. The gap is caution: alternative explanations for the differences are not considered. |
| Basic | A recital of dashboard values. Numbers repeated, trends described as improving or worsening, and no examination of what any of them are counting. |
| Non-performance | A required element is absent, commonly the issues the measures raise or any stated opportunity, and the criterion lands on the floor. |
The habit that earns the top column here is unglamorous and consistently missing from submitted work: state what would have to be true for your interpretation to be wrong. Small denominators produce dramatic rate swings. Reporting lag means a dashboard is describing last quarter. Groups that differ in staffing usually differ in case mix as well. Naming the rival explanation and then arguing past it is what makes an analysis defensible at master's level.
The NURS FPX 6222 Assessment 4 method, step by step
-
Inventory the measures before you interpret any of them
List what the setting actually reports, and for each one record the definition, the numerator and denominator, the exclusions, the data source, the collection method, the frequency, and the lag. Half of the issues you will write about are visible in that table alone, because measures collected by audit behave differently from measures pulled from a transaction system.
-
Separate structure, process, and outcome
Hours per patient day is a structural measure. Screening completion is a process measure. Readmission is an outcome. Confusing the three is the most common analytic error in this deliverable, because a structural measure cannot be improved into an outcome without the process in between, and the improvement plan has to name that process.
-
Test every difference against the obvious confounder
When two units differ, ask what else differs. Case mix, length of stay, admission source, and documentation practice all move measures on their own. If the more heavily staffed unit also admits fewer surgical patients, say so, then argue from what remains rather than pretending the comparison was clean.
-
Give small denominators the caution they require
A rate built on eleven events will move violently on the twelfth. Report counts alongside rates, use longer windows for rare events, and refuse to describe a two-point movement as a trend when the denominator cannot support one. Evaluators with quality department experience read for this specifically.
-
Interview for the mechanism, not for opinions
If your guide includes a conversation with a leader, use it to establish how the number is made and what it hides: who enters the data, what gets excluded, which report the committee actually looks at, what happened the last time the measure moved. Attribute the conversation by role rather than by name, and keep it as evidence about process rather than as testimony about quality.
-
Rank the opportunities by what the data supports
Close with two or three opportunities, ordered, each with the measure that would demonstrate it, the owner, and the collection burden it adds. An opportunity that requires a measure nobody produces contains a hidden data project, and saying so is part of the analysis rather than an admission against it.
A structure that maps to the criteria
Word targets our tutors plan against for an analysis of this kind, not Capella rules; expand where your guide asks for more.
| Section | What it must do | Guide |
|---|---|---|
| Setting and reporting apparatus | The organization, the measures it reports, and the forums those reports reach. | ~220 words |
| The measure inventory | Each measure with its definition, source, collection method, frequency, and reporting lag. | ~280 words |
| What the data shows | The values with periods and denominators, differences stated in counts as well as rates. | ~280 words |
| Issues in the measures | Confounding, small denominators, documentation effects, lag, and anything the set does not capture at all. | ~300 words |
| Opportunities, ranked | Two or three opportunities in order, each with its measure, owner, and added collection burden. | ~250 words |
| Limits and references | What would have to be true for the interpretation to fail, and current APA citations both ways. | ~150 words |
Annotated sample excerpt
An original model excerpt from our team, showing the caution that scores at the top of the guide. Take the reasoning, not the sentences.
Across the three medical units, contract nurses supplied thirty-one percent of worked registered nurse hours last quarter, and the divisional report shows admission assessment completeness at eighty-two percent on the two units above that average against ninety-six percent on the unit below it, with median time from documented deterioration to rapid response activation at twenty-two minutes and eleven minutes respectively.1 The comfortable conclusion is that contract staffing degrades documentation and escalation, and the data does not license it: the two higher-contract units also carry the division's oncology overflow, run a length of stay two and one tenth days longer, and admit thirty-eight percent of their patients overnight, when the assessment window collides with the busiest hours of the shift.2 What survives the confounding is narrower and more useful. Escalation timing is measured from a documented observation, so a unit that documents late will appear to escalate late, which makes the eleven minute figure partly a documentation measure and points the opportunity at when assessments are entered rather than at who is entering them.3
- 1Both figures carry their period and the comparison is stated in the measure's own terms. Reporting the contract share as a percentage of worked hours rather than of headcount is the precise version, and precision here is what makes the later caution credible.
- 2The rival explanation is named in full, with three specific confounders, before the writer argues past it. This paragraph is the one that separates a Distinguished analysis from a confident Basic one.
- 3The interpretation ends narrower than it began and redirects the opportunity from people to timing. Recognizing that one measure is partly measuring documentation is the kind of reading a quality department does and a dashboard never will.
The full premium sample for your exact assessment, written fresh to your scoring guide and issue, is free to request. Study it, revise it into your own voice, and submit work you understand.
The five mistakes that cost Distinguished
- Dashboard values recited. Repeating numbers is reporting. The criterion asks what the numbers are counting and what they cannot count.
- A trend declared on a small denominator. Rare events move rates violently. Report the count beside the rate and lengthen the window.
- Structure, process, and outcome treated interchangeably. A staffing figure cannot become a readmission result without the process between them, and the plan has to name it.
- Confounders left unmentioned. Units that differ in staffing differ in case mix too. An uncorrected comparison invites the evaluator to make the objection for you.
- Opportunities that need measures nobody collects. A hidden data collection project is a cost. Name it and it becomes analysis rather than oversight.
Pre-submission checklist
- Every measure inventoried with definition, source, collection method, frequency, and lag
- Structure, process, and outcome measures labeled as such
- Differences reported in counts as well as rates, with periods stated
- At least one rival explanation named and argued past for each key difference
- Two or three opportunities ranked, each with a measure, an owner, and its collection burden
- The interpretation's failure condition stated, and citations matched both ways in current APA
Working through your organization's measures?
Send the prompt, the criteria, and whatever measure definitions or reports you can share de-identified. We inventory the measures properly, test each difference against the obvious confounders, rank the opportunities by what the data supports, and state the limits out loud. Delivered inside 24 to 48 hours, read twice before it reaches you, revised free until the guide is met.