This manual is for MHA FPX 5068 Assessment 2, start to submission. Effective Leadership and Communication asks you to advise an organization, usually the facility in your courseroom scenario, on leading a health information technology implementation that has run into problems such as poor interoperability or low end-user acceptance: approaches for meeting those challenges, the roles leaders should play, strategies for ongoing communication, and how to manage the vendor relationship as the organization grows. The grade turns on leadership action. A description of implementation problems scores lower than specific leadership roles and communication practices that answer them. Below is the method our tutors use, a structure that maps to the criteria, and an annotated sample excerpt. Prefer to hand it off? A premium original sample for this exact assessment comes back in 24 to 48 hours, revised free until it meets the guide. Capella's catalog lists the course as MHA-FPX5068, and some courserooms print MHA5068; both point to this same Assessment 2. In current courserooms this assessment typically appears as "Effective Leadership and Communication".
One honesty note before the manual: Capella revises courses and scoring guides over time, so always write to the exact scoring guide attached to your assessment in the courseroom. The course identity above is verified on capella.edu; the method and structure below are our tutors' approach to it, not Capella's official rubric text.
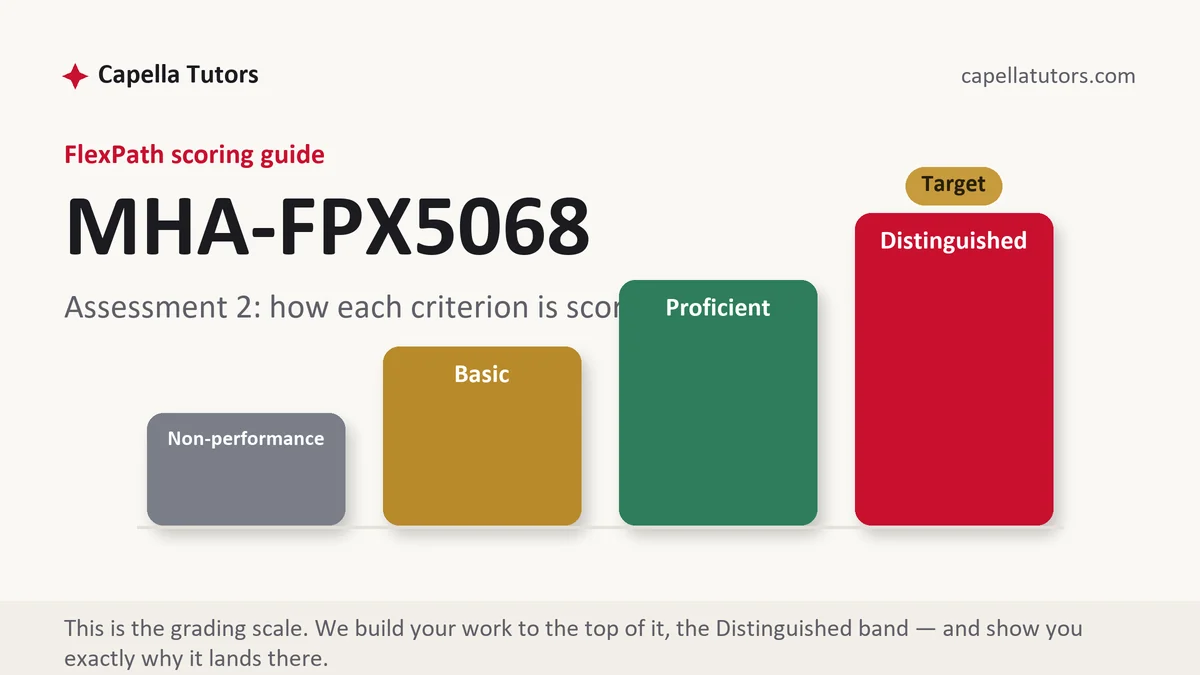
How MHA FPX 5068 Assessment 2 is scored
FlexPath does not use letter grades. Each criterion in the scoring guide lands on one of four levels, and the level descriptions are the real writing brief:
| Level | What it means on a technology leadership paper |
|---|---|
| Distinguished | Implementation challenges are identified from the scenario, approaches answer each challenge with evidence, leadership roles are specific, communication strategies are ongoing and two-way, and vendor management is practical. |
| Proficient | All parts are present and accurate, but roles and communication strategies are general. |
| Basic | The paper describes implementation problems with little leadership guidance. |
| Non-performance | The leadership roles, the communication strategies or the vendor discussion is missing. |
Use the scenario's facts about the system, the vendor and the staff. Recommendations should fit that organization.
The MHA FPX 5068 Assessment 2 method, step by step
-
Identify the challenges
Interoperability, user acceptance, training gaps, workflow disruption, from the scenario.
-
Propose approaches
Super users, phased rollout, workflow redesign, interface work, each with evidence.
-
Define leadership roles
Executive sponsor, clinical champions, IT and project leads, and what each does.
-
Plan ongoing communication
Regular updates, feedback channels and response to concerns.
-
Manage the vendor relationship
Contract terms, service levels, escalation and planning for growth.
-
Conclude
The priorities for leadership.
A structure that maps to the criteria
Word counts are planning targets our tutors use, not Capella rules; follow the length and format your scoring guide states.
| Section | What it must do | Guide |
|---|---|---|
| Background | The organization and the implementation challenges. | ~125 words |
| Approaches to challenges | Responses with evidence. | ~150 words |
| Leadership roles | Who leads what. | ~125 words |
| Ongoing communication strategies | How communication continues. | ~125 words |
| Vendor relationships and growth | Managing the vendor. | ~100 words |
| References | Current APA. | as needed |
Annotated sample excerpt
An original model excerpt from our team, written to show the register that reaches the top of the guide. Learn the moves, then write your own version.
The implementation stalled partly because no one with clinical authority owned it: IT ran the project, and physicians experienced the new system as something done to them.1 The first leadership change should be to name a physician champion and a nurse champion who sit on the steering group, review configuration decisions before they reach the floor, and speak for the system at department meetings.2 The chief operating officer remains the executive sponsor, responsible for resources and for holding the vendor to its commitments, so clinical ownership and executive accountability are separate and visible.3
- 1Diagnoses a leadership gap from the scenario.
- 2Defines specific roles and what they do.
- 3Separates clinical ownership from executive accountability.
The full premium sample for your exact assessment, written fresh to your scoring guide and topic, is free to request. Study it, revise it into your own voice, and submit work you understand.
The five mistakes that cost Distinguished
- Problems without solutions. Pair each challenge with an approach.
- Roles left vague. Name who does what.
- One-time communication. Plan ongoing, two-way communication.
- Ignoring the vendor. Address the relationship and growth.
- Generic advice. Fit recommendations to the scenario.
Pre-submission checklist
- Challenges identified from the scenario
- Approaches with evidence
- Specific leadership roles
- Ongoing communication strategies
- Vendor management for growth
- Current APA references
Want the leadership paper written?
Send the scoring guide and the scenario. Our team returns a premium original paper in 24 to 48 hours, revised free until it meets the guide.