This manual is for MHA FPX 5028 Assessment 2, start to submission. The NGO Proposal asks you to work with a proposal for a nongovernmental organization's global health project, usually on an infectious disease or similar priority: summarize it, analyze it from the perspective of the stakeholders it serves and funds, assess its objectives, evaluate how the project would be measured, and recommend whether and how it should proceed. The grade turns on judgment. A summary of the proposal scores lower than an analysis that tests its objectives and evaluation plan against evidence and the realities of the setting. Below is the method our tutors use, a structure that maps to the criteria, and an annotated sample excerpt. Prefer to hand it off? A premium original sample for this exact assessment comes back in 24 to 48 hours, revised free until it meets the guide. Capella's catalog lists the course as MHA-FPX5028, and some courserooms print MHA5028; both point to this same Assessment 2. In current courserooms this assessment typically appears as "NGO Proposal".
One honesty note before the manual: Capella revises courses and scoring guides over time, so always write to the exact scoring guide attached to your assessment in the courseroom. The course identity above is verified on capella.edu; the method and structure below are our tutors' approach to it, not Capella's official rubric text.
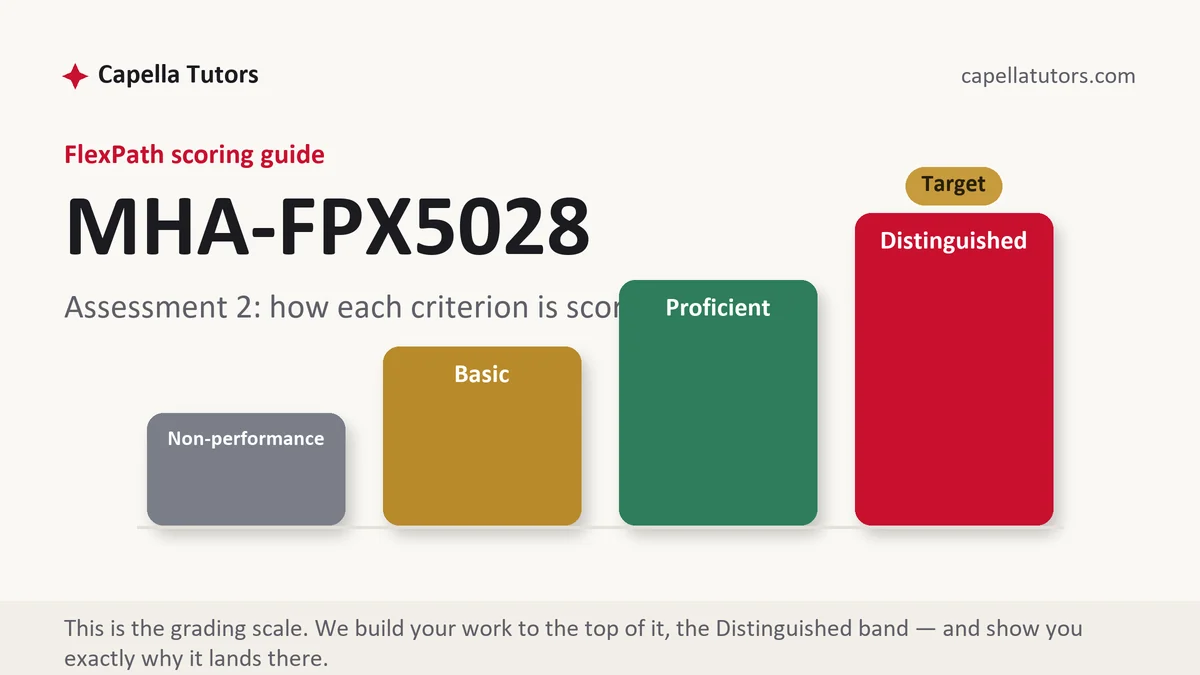
How MHA FPX 5028 Assessment 2 is scored
FlexPath does not use letter grades. Each criterion in the scoring guide lands on one of four levels, and the level descriptions are the real writing brief:
| Level | What it means on an NGO proposal analysis |
|---|---|
| Distinguished | The proposal is summarized accurately, stakeholder perspectives are analyzed, objectives are tested for measurability and fit, the evaluation plan is assessed, and the recommendation follows from the analysis with evidence. |
| Proficient | The analysis is accurate, but objectives and evaluation are accepted rather than tested. |
| Basic | The paper summarizes the proposal with little analysis. |
| Non-performance | The objectives analysis, the evaluation assessment or the recommendation is missing. |
Use the proposal or scenario your courseroom provides, and ground your analysis in global health evidence.
The MHA FPX 5028 Assessment 2 method, step by step
-
Write an executive summary
The problem, the NGO, the proposed project and its cost in a short paragraph.
-
Analyze the perspective
Who benefits, who funds, who implements, and whose interests might conflict.
-
Test the objectives
Are they specific and measurable, and do they fit the burden and the setting?
-
Assess the evaluation plan
Indicators, data sources and timelines, and whether they would show impact.
-
Weigh feasibility and sustainability
Funding, local partnerships and what happens when the NGO leaves.
-
Recommend
Proceed, revise or decline, with the reasons.
A structure that maps to the criteria
Word counts are planning targets our tutors use, not Capella rules; follow the length and format your scoring guide states.
| Section | What it must do | Guide |
|---|---|---|
| Executive summary | The proposal in brief. | ~125 words |
| Proposal analysis and perspective | Stakeholders and interests. | ~175 words |
| Objectives | Measurability and fit. | ~150 words |
| Project evaluation | Indicators and design. | ~150 words |
| Conclusion, recommendation and references | Recommendation, then current APA. | ~100 words |
Annotated sample excerpt
An original model excerpt from our team, written to show the register that reaches the top of the guide. Learn the moves, then write your own version.
The proposal's first objective, to "improve awareness of tuberculosis in the district," cannot be evaluated as written, because it names no population, no measure and no date.1 A measurable version would be to increase the share of adults in the district who can name the main symptoms of tuberculosis from a surveyed baseline to a stated target within eighteen months, measured by household survey.2 The second objective, case detection, is stronger because it is tied to clinic records, which is why the recommendation is to fund the project on the condition that the awareness objective is rewritten before launch.3
- 1Tests an objective against measurability and finds it lacking.
- 2Rewrites it so it could be evaluated.
- 3Ties the analysis to a conditional recommendation.
The full premium sample for your exact assessment, written fresh to your scoring guide and topic, is free to request. Study it, revise it into your own voice, and submit work you understand.
The five mistakes that cost Distinguished
- Summarizing only. Analyze and test the proposal.
- Accepting objectives as written. Check that they are measurable.
- Ignoring sustainability. Ask what happens after funding ends.
- No stakeholder view. Consider funders, implementers and communities.
- A recommendation without reasons. Base it on the analysis.
Pre-submission checklist
- Executive summary
- Stakeholder perspective analyzed
- Objectives tested for measurability and fit
- Evaluation plan assessed
- Feasibility and sustainability weighed
- Recommendation and current APA references
Want the NGO proposal analysis written?
Send the scoring guide and the proposal. Our team returns a premium original analysis in 24 to 48 hours, revised free until it meets the guide.