This manual is for MHA FPX 5017 Assessment 3, start to submission. Predicting an Outcome Using Regression Models asks you to use the course data set to build a regression model that predicts a health care outcome, report and interpret the output, including which coefficients are significant and how large their effects are, and explain how the results should and should not inform a management decision. The grade turns on interpretation. Pasting output scores low; explaining what each coefficient means in the units of the problem, and what the model cannot tell you, scores high. Below is the method our tutors use, a structure that maps to the criteria, and an annotated sample excerpt. Prefer to hand it off? A premium original sample for this exact assessment comes back in 24 to 48 hours, revised free until it meets the guide. Capella's catalog lists the course as MHA-FPX5017, and some courserooms print MHA5017; both point to this same Assessment 3. In current courserooms this assessment typically appears as "Predicting an Outcome Using Regression Models".
One honesty note before the manual: Capella revises courses and scoring guides over time, so always write to the exact scoring guide attached to your assessment in the courseroom. The course identity above is verified on capella.edu; the method and structure below are our tutors' approach to it, not Capella's official rubric text.
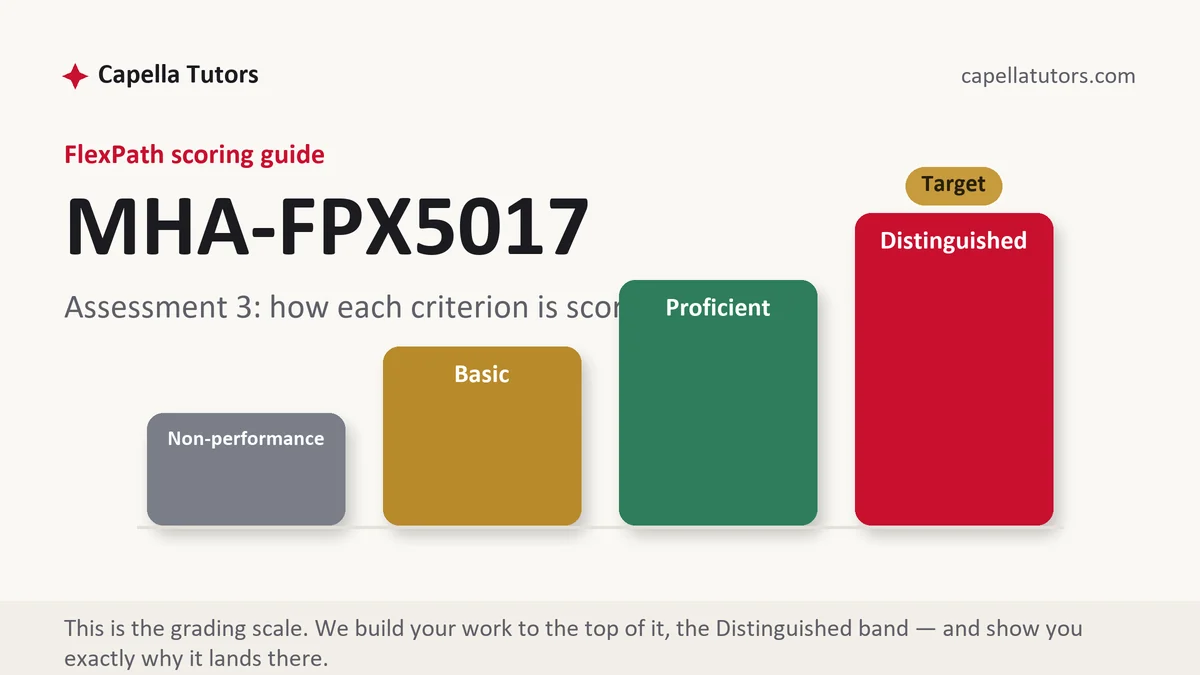
How MHA FPX 5017 Assessment 3 is scored
FlexPath does not use letter grades. Each criterion in the scoring guide lands on one of four levels, and the level descriptions are the real writing brief:
| Level | What it means on a regression analysis |
|---|---|
| Distinguished | The outcome and predictors are defined, the model choice is justified, output is reported accurately, significance and effect sizes are interpreted in plain terms, assumptions and limits are addressed, and the decision implications follow from the results. |
| Proficient | Output is reported and interpreted correctly, but the decision implications or limits are brief. |
| Basic | Output is pasted with little interpretation. |
| Non-performance | The model, the interpretation or the decision discussion is missing. |
Use the data set and software the course provides, and report the exact figures from your output.
The MHA FPX 5017 Assessment 3 method, step by step
-
Define the question
The outcome you are predicting, the predictors, and why a manager would care.
-
Choose the model
Linear regression for a continuous outcome, logistic for a yes or no outcome, with the reason.
-
Run and report
Coefficients, standard errors, p-values, R squared or the relevant fit statistic, in a clean table.
-
Interpret significance and size
Which predictors matter and by how much, in the units of the problem.
-
Check assumptions and limits
Linearity, independence, multicollinearity, and the difference between prediction and causation.
-
Connect to the decision
What the results suggest a manager should do, and what further evidence would be needed.
A structure that maps to the criteria
Word counts are planning targets our tutors use, not Capella rules; follow the length and format your scoring guide states.
| Section | What it must do | Guide |
|---|---|---|
| Introduction | The decision question and the data. | ~100 words |
| Model and method | Outcome, predictors and model choice. | ~125 words |
| Results | Output table and key figures. | ~150 words plus table |
| Interpretation | Significance and effect sizes in plain terms. | ~200 words |
| Assumptions and limits | What the model can and cannot show. | ~125 words |
| Decision implications and references | What a manager should do, then current APA. | ~125 words |
Annotated sample excerpt
An original model excerpt from our team, written to show the register that reaches the top of the guide. Learn the moves, then write your own version.
Length of stay is the strongest predictor in the model: holding the other variables constant, each additional inpatient day is associated with an increase of about 410 dollars in total cost, and the coefficient is significant at p < .001.1 Age is also significant but much smaller in practical terms, about 22 dollars per year of age, which means a ten-year difference between two patients matters less than a single extra day in the hospital.2 Because the data are observational, the model predicts cost well but does not show that shortening stays would reduce cost by the same amount, so the decision it supports is where to look first, not a guaranteed saving.3
- 1Interprets a coefficient in the units of the problem, with its significance.
- 2Compares effect sizes so the reader sees practical importance.
- 3States the limit of prediction versus causation and scales the decision accordingly.
The full premium sample for your exact assessment, written fresh to your scoring guide and topic, is free to request. Study it, revise it into your own voice, and submit work you understand.
The five mistakes that cost Distinguished
- Pasting output. Interpret every figure you report.
- Confusing significance with size. Discuss both.
- Ignoring assumptions. Name the checks and limits.
- Claiming causation. Regression on these data predicts; it does not prove cause.
- No decision link. Say what the results mean for a manager.
Pre-submission checklist
- Outcome and predictors defined
- Model choice justified
- Output reported accurately
- Significance and effect sizes interpreted
- Assumptions and limits addressed
- Decision implications and current APA references
Want the regression analysis written up?
Send the scoring guide, the data set and your output. Our team returns a premium original analysis in 24 to 48 hours, revised free until it meets the guide.