This manual is for MHA FPX 5017 Assessment 2, start to submission. Assessment 2 is the inference deliverable, and the assessment usually asks you to compare something: two groups, several groups, two proportions, or two variables moving together, with the procedure justified from the variable types before it is run, the assumptions checked in writing, and the finding reported as an effect with an interval around it rather than as a verdict. Below is the method, a structure that follows the criteria, and an annotated sample excerpt showing how a result should be reported. Would you rather we ran it? A premium original sample for this assessment is back inside 24 to 48 hours, revised free until each criterion clears. Capella's catalog lists the course as MHA-FPX5017, and some courserooms print MHA5017; both point to this same Assessment 2. In current courserooms this assessment typically appears as "Hypothesis Testing for Differences Between Groups".
One honesty note before the manual: Capella revises courses and scoring guides over time, so always write to the exact scoring guide attached to your assessment in the courseroom. The course identity above is verified on capella.edu; the method and structure below are our tutors' approach to it, not Capella's official rubric text.
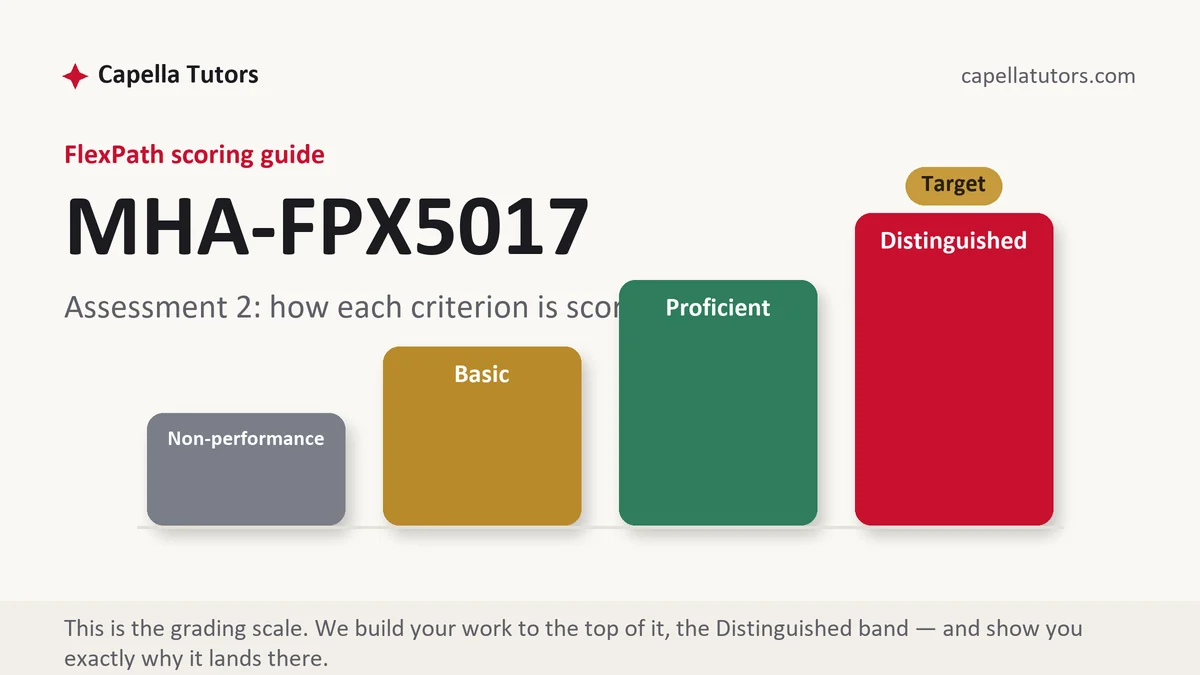
How MHA FPX 5017 Assessment 2 is scored
The guide holds four levels for every criterion and no letter grade sits behind them. Each level is written as a description and functions as an instruction:
| Level | What it means on an inferential analysis |
|---|---|
| Distinguished | The procedure is defended from the variable types and the design before any output appears, assumptions are reported whether or not they held, and the result is read as an effect with an interval in the units the decision is made in. The gap between the top two rows is usually one sentence; write it deliberately. |
| Proficient | The right test was run and reported correctly. Correct, and silent about what the interval means for the choice in front of the organization. |
| Basic | Output pasted in and narrated, with a p value doing all the work and no effect size anywhere on the page. |
| Non-performance | A required element is missing, most often the assumption check or the interval. Nothing can be scored where nothing was reported. |
A p value answers a question about what the data would look like if nothing were happening. Whether the effect is large enough to change what the organization does is a separate question, and the criteria in this course are built so that answering only the first one caps the row.
The MHA FPX 5017 Assessment 2 method, step by step
-
Choose the procedure from the variables, then write down why
Two independent groups on a measured outcome is a comparison of means, with the rank based alternative where the distribution is badly skewed or the samples are small. The same patients measured twice is a paired comparison. More than two groups needs a stated correction for the extra comparisons. Two categorical variables belong on a contingency table. Put the reason in the paper, not only the result.
-
Check the assumptions and report them either way
Independence, shape, spread, and whatever else the procedure carries. Say what you examined, say what you found, and where an assumption fails, say what you did instead. Silent assumption checking looks identical to no assumption checking from the evaluator's side of the page.
-
Report the effect before the p value
The difference, the ratio or the coefficient comes first, with its confidence interval, in the units somebody makes a decision in. A p value with no effect beside it tells a reader whether to be surprised, not whether to act.
-
Read the interval out loud
State what the analysis would mean at each end of it. An interval running from a trivial harm to a substantial benefit is not evidence of nothing; it is evidence the study was too small to settle a question worth settling, and making that distinction is worth a criterion by itself.
-
Say how many comparisons you ran
Test twelve measures at the usual threshold and roughly one will look significant by construction. Report the count of comparisons, apply a correction where the design calls for one, and never present the single survivor as though it had been the only question asked.
-
Turn the statistic into a recommendation, then submit early
Say what you would do, at what confidence, and what would change your mind. Then submit with days in hand, because one misread column propagates into every conclusion built on it and the revision cycle is where that gets caught.
A structure that maps to the criteria
The targets below are planning figures our tutors use for a typical 5017 comparison paper, not Capella limits; a criterion carrying extra weight deserves extra room.
| Section | What it must do | Guide |
|---|---|---|
| Question and hypotheses | The comparison being made, stated in the organization's terms and then in statistical terms. | ~150 words |
| Data and groups | How the groups were formed, the counts in each, the exclusions, and what makes the groups unequal. | ~250 words |
| Procedure and assumptions | The test chosen, the reason drawn from variable types and design, and every assumption check performed. | ~300 words |
| Results | The effect, its interval, the test statistic, the sample size, and the output referenced by table. | ~300 words |
| Interpretation | What the result means at each end of the interval, translated into the units of the decision. | ~250 words |
| Limits, next analysis and references | Confounding, selection, multiplicity, what would settle it, current APA both ways. | ~200 words |
Annotated sample excerpt
An original paragraph from our analysts showing how a result and its caveats belong in the same breath. Take the pattern, then report your own numbers inside it.
Blood pressure was at goal in 96 of 214 patients seen in the pharmacist-led clinic, 44.9 percent, against 118 of 322 in usual primary care, 36.6 percent, a difference of 8.3 percentage points with a 95 percent interval running from 0.2 to 16.4 points and a p value of 0.049.1 Assignment was not random: patients were referred, and referred patients differ from the ones nobody thought to refer, so the comparison is adjusted for age, baseline pressure and the count of antihypertensive agents, after which the difference falls to 6.1 points and the interval crosses zero.2 The honest reading is that the clinic plausibly helps by somewhere between nothing and a clinically meaningful margin, that 536 patients cannot separate those two possibilities, and that two further quarters of enrollment would.3
- 1Counts sit beside every percentage and the interval arrives in the same sentence as the p value, so no reader has to take the significance claim on trust.
- 2The selection problem is named by the writer rather than left for the evaluator, and the adjusted result is reported even though it weakens the finding.
- 3The conclusion says what the data can and cannot settle and what would settle it. All figures here are constructed to demonstrate the reporting pattern.
The full premium sample for your exact assessment, written fresh to your scoring guide and issue, is free to request. Study it, revise it into your own voice, and submit work you understand.
The five mistakes that cost Distinguished
- A test chosen by habit. A comparison of means run on proportions or on monthly rates, which is a different error wearing the same tidy appearance.
- Assumptions checked in silence. Nothing in the document shows whether the writer looked, so the criterion has no evidence in front of it to score.
- A p value above the threshold read as proof of no effect. The most expensive misreading in the course, and printing the interval prevents it.
- An effect with no units anybody decides in. A standardized coefficient nobody can convert into days, dollars or patients leaves the recommendation unsupported.
- Twelve tests, one reported. Presenting the survivor of a fishing trip as though it had been the only question on the table.
Pre-submission checklist
- The procedure justified from variable types and design, in writing, ahead of the output
- Every assumption named, checked and reported whether or not it held
- Effect and confidence interval printed before the p value
- Both ends of the interval interpreted in the units the decision uses
- The number of comparisons stated, with a correction where the design needs one
- Self-scored across the guide, current APA both ways, submitted early in the week
Comparison to run and defend?
Send the data or the output with your guide. The analyst picks the procedure and writes the defense, tests the assumptions, tables the effect with its interval, and the premium original sample returns inside 24 to 48 hours through a numbers pass matching every figure in the prose to the figures in the tables. Free revisions until each criterion clears.