This manual is for MHA FPX 5017 Assessment 1, start to submission. Assessment 1 tests whether you can describe a dataset before you argue with it, and the assessment usually hands you data or output and asks what it says about a named population: variable types identified first, the shape of each distribution inspected, and summary statistics chosen because the shape justified them rather than because the software printed them. What follows is the working method, a structure the criteria can be checked against, and an annotated sample excerpt. Prefer to hand the file over? A premium original sample for this assessment returns in 24 to 48 hours with unlimited free revisions until the guide is met. Capella's catalog lists the course as MHA-FPX5017, and some courserooms print MHA5017; both point to this same Assessment 1. In current courserooms this assessment typically appears as "Nursing Home Data Analysis".
One honesty note before the manual: Capella revises courses and scoring guides over time, so always write to the exact scoring guide attached to your assessment in the courseroom. The course identity above is verified on capella.edu; the method and structure below are our tutors' approach to it, not Capella's official rubric text.
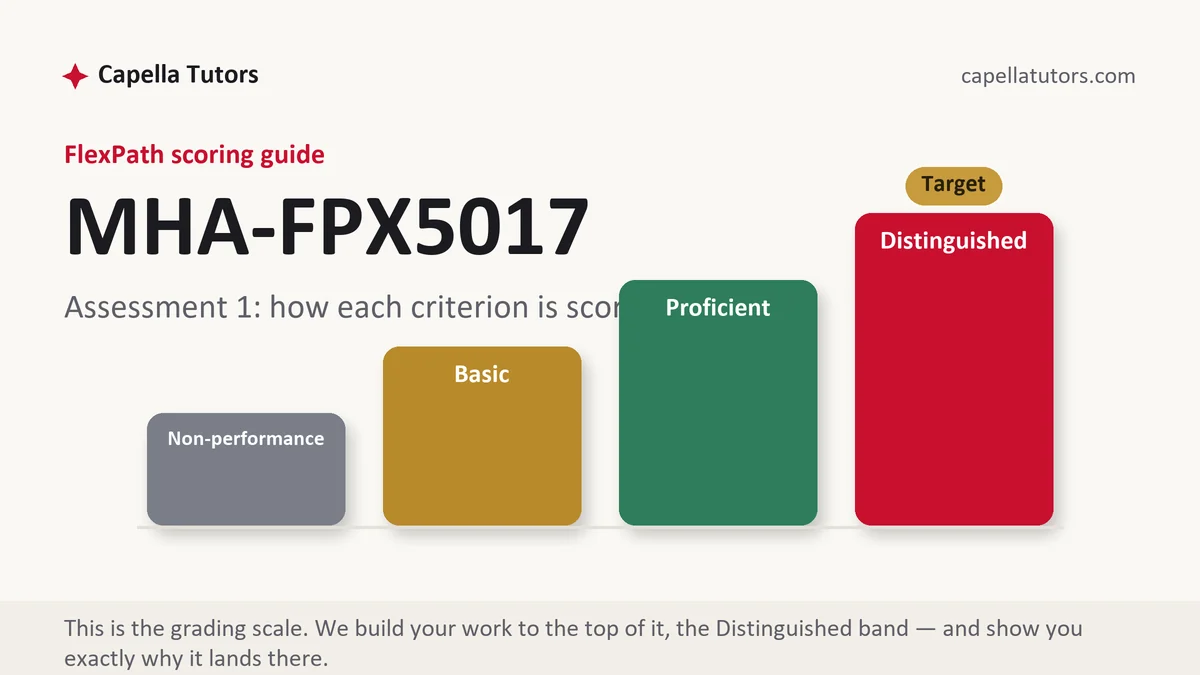
How MHA FPX 5017 Assessment 1 is scored
Nothing here is graded on a curve. Each criterion is placed at one of four levels, and the level wording is a checklist somebody has already written for you:
| Level | What it means on a descriptive analysis |
|---|---|
| Distinguished | Variable types are classified before anything is computed, the shape of the distribution decides which statistic is reported, and the tail is described rather than quietly trimmed. Whatever the top row asks for beyond the row below it is the sentence to write next. |
| Proficient | The description is correct and complete, the right statistics appear, and a reader learns what the data holds. Accurate, and stopping where the interesting part starts. |
| Basic | A mean for everything, no shape, no counts, and a paragraph that repeats the table in words. Common, and liftable with one honest paragraph about the tail. |
| Non-performance | Something the criterion required is missing, usually the data quality section or the exclusions. An absent element takes the row to the floor. |
In health care data the description is frequently the finding. Cost per case, length of stay, waiting time and days in a receivable are skewed nearly everywhere anyone measures, and a paragraph explaining where the tail sits is usually worth more to a reader than any test you could run on the same file.
The MHA FPX 5017 Assessment 1 method, step by step
-
Write the decision before you open the file
One sentence: who is choosing what, and which number would move them. An analysis without that sentence drifts into describing everything available, and the communication criterion exists to catch exactly that drift. Put the sentence at the top of your outline and cut any output that does not serve it.
-
Classify every variable
Category, ordered rating, count, measured quantity. The permitted arithmetic follows from the classification, and averaging an ordered rating is the fastest way to lose a criterion in the opening section. Put the classification in a table so an evaluator sees the reasoning without hunting for it.
-
Look at the shape before choosing a statistic
Plot it, or at minimum set the mean beside the median. Where the two separate, the variable is skewed, and the median with a spread describes the typical case while the mean describes the total resource. Report both, then say which one your decision needs.
-
Count the exclusions
Every record you dropped, with the reason and the number: missing values, admissions outside the window, transfers, test accounts. An analysis whose denominator cannot be reconstructed is an opinion with decimal places, and this section is cheap to write and expensive to leave out.
-
Describe the tail in prose
Say how many cases sit in it, what share of the total they carry, and what happens to the summary when they are removed. That paragraph converts a table into a finding, and it usually points straight at whichever intervention the assessment expects you to reach.
-
Build the table a busy reader could use, then submit early
One table, labeled axes on any figure, denominators visible, no truncated baselines. Read it as somebody with ninety seconds and no interest in your method. Then submit early in the week, since evaluation takes up to two business days and a numbers paper always needs one revision pass.
A structure that maps to the criteria
The word targets below are our tutors' planning figures for a typical 5017 descriptive paper, not Capella rules; expand whichever section your scoring guide loads with criteria.
| Section | What it must do | Guide |
|---|---|---|
| Question and audience | The decision on the table, who makes it, and the number that would change their mind. | ~150 words |
| Data and provenance | Source system, extract window, inclusions, exclusions with counts, and the defects you already know about. | ~250 words |
| Variable classification | Each variable typed, with the arithmetic each type permits stated once and applied throughout. | ~200 words |
| Distribution and summary statistics | Shape first, then the statistics that shape justifies, with counts printed beside every rate. | ~350 words |
| What the description implies | The tail, the concentration, and the group the decision actually concerns. | ~300 words |
| Limits and references | What the description cannot settle, which analysis comes next, current APA matched both ways. | ~150 words |
Annotated sample excerpt
A worked paragraph from our writers, built to show how a description turns into a finding. Read it for the moves, then write the version your own data supports.
The center performed 6,180 cases across four rooms last year with a mean in-room time of 71 minutes, a median of 58 and a standard deviation of 39, so the average is describing the tail rather than the ordinary case.1 The longest 5 percent, 309 cases averaging 174 minutes, consume 53,766 of the 438,780 total in-room minutes, which is 12.3 percent of capacity sitting on one twentieth of the schedule, and eleven surgeons account for 214 of those 309 cases.2 A capacity plan built on the mean would add a fifth room; a capacity plan built on the distribution would first ask why eleven schedules are booked against a block length the historical data does not support, and the second question is far cheaper to answer.3
- 1Mean and median appear together and the gap between them is interpreted, which is the move the descriptive criterion is built around.
- 2The tail is counted, converted into a share of total capacity and then attributed, so a reader knows exactly which part of the schedule the finding concerns.
- 3The description is carried into the decision without a test being run. Every figure here is constructed to demonstrate the reasoning rather than drawn from a real center.
The full premium sample for your exact assessment, written fresh to your scoring guide and issue, is free to request. Study it, revise it into your own voice, and submit work you understand.
The five mistakes that cost Distinguished
- A mean with no median beside it. The one habit that hides the tail an intervention would have to touch, and it turns up in most first drafts.
- Percentages floating free. A rate with no denominator, or a denominator that changes quietly between two tables in the same document.
- Exclusions mentioned but never counted. Saying incomplete records were removed without a number leaves a reader unable to rebuild the population.
- An ordered rating averaged. Treating a satisfaction scale as a measured quantity, which an evaluator reads as a classification error rather than a rounding choice.
- A figure with a truncated baseline. An axis starting partway up manufactures a trend, and a reader who notices will discount everything else in the document.
Pre-submission checklist
- The decision written in one sentence before any output was produced
- Every variable classified, with the arithmetic its type permits
- Shape examined and reported, median and spread present wherever the variable is skewed
- Exclusions counted with reasons, so the denominator can be rebuilt
- The tail described in prose, with its share of the total printed
- Self-scored on every criterion, current APA both ways, submitted early in the week
Dataset to describe this week?
Send the file or the output with your scoring guide. An analyst classifies the variables, inspects every distribution, counts the exclusions and writes the tail paragraph, and a premium original sample comes back inside 24 to 48 hours with every figure in the narrative matched to the figures in the tables. Revisions are free until the criteria clear.