This manual is for IT FPX 4250 Assessment 2, start to submission. The middle deliverable in this course is graded on judgment rather than on model choice, and the single most graded decision in it is which metric you lead with. Accuracy is almost always the wrong headline when the interesting class is rare, and a submission that reports it without a confusion matrix underneath has handed an evaluator the easiest criticism in the course. Leakage is the other defect that decides grades here, because information that would not exist at prediction time produces a stunning result and a useless model. Below is the method our tutors use for it, a structure that maps to the criteria, and an annotated sample excerpt. Prefer to hand it off? A premium original sample for this exact assessment comes back in 24 to 48 hours, revised free until it meets the guide. Capella's catalog lists the course as IT-FPX4250, and some courserooms print IT4250; both point to this same Assessment 2.
One honesty note before the manual: Capella revises courses and scoring guides over time, so always write to the exact scoring guide attached to your assessment in the courseroom. The course identity above is verified on capella.edu; the method and structure below are our tutors' approach to it, not Capella's official rubric text.
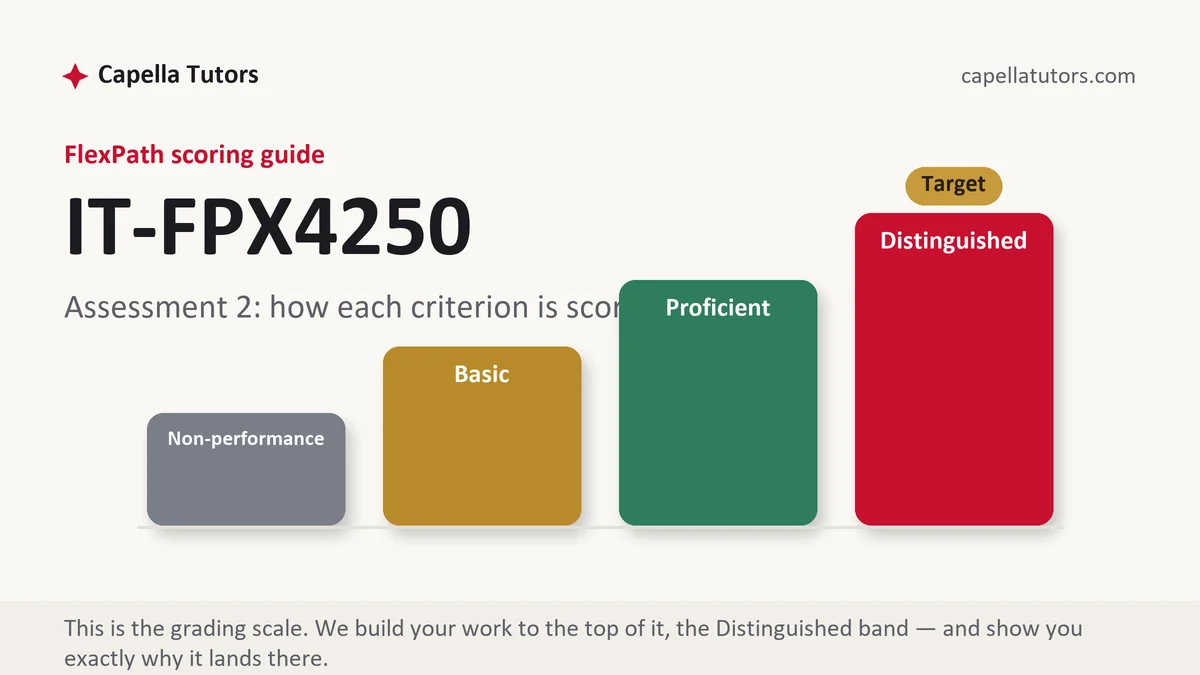
How IT FPX 4250 Assessment 2 is scored
Nothing here is a percentage of anything. An evaluator places each criterion at one of four levels, and the level text is the most direct instruction available to you:
| Level | What it means on a modeling and evaluation deliverable |
|---|---|
| Distinguished | The metric is chosen for the class balance and the cost of each error, leakage is addressed by name, and a simple baseline exists for the model to beat. Each criterion carries one extra move; take it. |
| Proficient | A model built properly with metrics reported and a split that holds. Real work that has not yet translated the numbers into what somebody should do. |
| Basic | A model with an impressive accuracy figure, a short paragraph of interpretation, and no baseline in sight. |
| Non-performance | A required element is missing, most often the confusion matrix or the split strategy. An absent element takes its row down by itself. |
Report the confusion matrix first, because every other number is derived from it and showing it stops anyone accusing you of choosing the flattering statistic. Then say which error the organization would rather make, since that sentence is what turns an evaluation into a recommendation.
The IT FPX 4250 Assessment 2 method, step by step
-
Establish the simple baseline before the model
Take a wind farm operator predicting gearbox failures from turbine sensor data. Write down what a plain rule achieves first, such as inspecting any turbine whose vibration exceeds a threshold the maintenance team already uses. Without something simpler to beat, an improvement has nothing to be an improvement over, and the criteria treat a missing baseline as a missing section.
-
Split before you look, and hold the test set back
Training, validation, and test partitions protect you from grading your own homework. Where the data has a time dimension, split by time rather than at random, because a model trained on next month and tested on last month has been told the future and will report a number nobody can reproduce in service.
-
Hunt leakage on purpose
Go through the feature list and ask of each one whether it would exist at the moment the prediction is needed. A maintenance work order number, a replacement part code, or a technician's note are all recorded after somebody already knew there was a problem, and any of them will produce a result too good to be true. Say in the document which features you removed for this reason.
-
Do the arithmetic that shows why accuracy fails here
Take 15,000 turbine-weeks of which 45 ended in a gearbox failure, a rate of 0.3 percent. A model predicting no failure every time is 99.7 percent accurate and worth nothing. Now take a real model catching 33 of the 45 while raising an alarm on 2 percent of the 14,955 healthy weeks, which is 299 false alarms: recall is 73 percent, precision is 33 divided by 332, near 10 percent, and the operational meaning is about ten inspections per genuine catch.
-
Choose the metric by the cost of being wrong
Whether that model is good depends entirely on what an inspection costs against what an unplanned gearbox replacement costs, including the crane and the lost generation. Work both numbers out, pick the threshold accordingly, and state which error you are choosing to tolerate. A combined score is a reasonable summary and a poor headline, because it hides the choice you just made.
-
Say what changes operationally, then self-score
A prediction nobody acts on is a report with extra steps, so name who receives the alert, what they do, and how the outcome is fed back so the model can be re-evaluated. Then mark each criterion D, P, B, or N and revise anything below the top before uploading early in the week.
A structure that maps to the criteria
These proportions are how our tutors plan an evaluation write-up rather than Capella limits; tables, matrices, and code sit outside the count.
| Section | What it must do | Guide |
|---|---|---|
| Problem and baseline | The prediction being made, when it is needed, and what a simple rule already achieves. | ~250 words |
| Data and features | The features used, the ones removed for leakage, and why each removal was necessary. | ~250 words |
| Method and split | The approach taken, the partitioning strategy, and why a time-based split was or was not required. | ~250 words |
| Results | The confusion matrix in full, precision and recall together, and the threshold selected. | ~300 words |
| Cost of error | What each error type costs in the scenario, and the threshold argument that follows from those numbers. | ~300 words |
| Operational use and sources | Who acts on a prediction, how outcomes return, model limits, and methods references in current APA. | ~200 words |
Annotated sample excerpt
One original model passage from our team, at the register the guide's top column describes. Read it for the way it refuses a flattering number.
Of 15,000 turbine-weeks in the training window, 45 ended in a gearbox failure, a base rate of 0.3 percent, which means a model predicting no failure every week would report 99.7 percent accuracy while identifying nothing, and accuracy is therefore not reported as a headline anywhere in this evaluation.1 The selected model identifies 33 of the 45 failures and raises an alarm on 2 percent of the 14,955 healthy weeks, which is 299 false alarms, giving recall of 73 percent and precision of 33 divided by 332, close to 10 percent, or roughly ten borescope inspections for each failure caught.2 At an inspection cost near 2,000 dollars against an unplanned gearbox replacement in the region of 250,000 dollars including crane hire and lost generation, ten inspections to prevent one replacement is a favorable trade, and the threshold is set to prefer recall with that arithmetic stated rather than assumed.3
- 1Kills the flattering metric with the base rate before anyone can quote it back. Naming the number you refuse to lead with is a stronger move than quietly omitting it.
- 2Gives precision and recall together with the count behind each, then converts them into the operational unit somebody actually manages, which is inspections per catch.
- 3Prices both errors and lets the comparison choose the threshold. The recommendation is now something a maintenance manager could argue with on the numbers.
The full premium sample for your exact assessment, written fresh to your scoring guide and issue, is free to request. Study it, revise it into your own voice, and submit work you understand.
The five mistakes that cost Distinguished
- Accuracy reported on an imbalanced problem. A figure that a constant prediction would beat tells a reader nothing about the model.
- No confusion matrix. Without it, every derived number is an assertion and the reader cannot check which error you tolerated.
- A random split on time-ordered data. Testing on the past after training on the future produces a result service will never reproduce.
- Features that postdate the event. A work order or a part code encodes the answer, and the model that uses them has learned nothing.
- Metrics reported on the fitting data. A number produced from the rows the model already saw is a description of memory, not of performance.
Pre-submission checklist
- A simple baseline is stated with what it achieves before the model appears
- The split strategy is named, with time-based partitioning used where the data requires it
- Features removed for leakage are listed with the reason for each
- The confusion matrix appears in full, with precision and recall reported together
- Both error types are priced, and the threshold follows from those figures
- Who acts on a prediction and how outcomes return are stated, then every row self-scored
Evaluation due and the numbers look too good?
Send the dataset shape, the class balance if you know it, and the criteria. A premium original returns inside 24 to 48 hours with a baseline, a defensible split, leakage removed and named, and a metric chosen from the cost of each error. First sample free.