This manual is for IT FPX 4250 Assessment 1, start to submission. The opening deliverable in this course usually asks you to design a data path and account for it, which is a different skill from running a notebook. It starts with the decision the analysis is supposed to inform, then the honest profile of the data you actually have, then a pipeline described end to end including what happens when a step fails at three in the morning. Analytics submissions drift because the student begins with the dataset instead of the question, and an exploration that decides nothing lands in the middle of the guide however attractive the charts are. Below is the method our tutors use for it, a structure that maps to the criteria, and an annotated sample excerpt. Prefer to hand it off? A premium original sample for this exact assessment comes back in 24 to 48 hours, revised free until it meets the guide. Capella's catalog lists the course as IT-FPX4250, and some courserooms print IT4250; both point to this same Assessment 1.
One honesty note before the manual: Capella revises courses and scoring guides over time, so always write to the exact scoring guide attached to your assessment in the courseroom. The course identity above is verified on capella.edu; the method and structure below are our tutors' approach to it, not Capella's official rubric text.
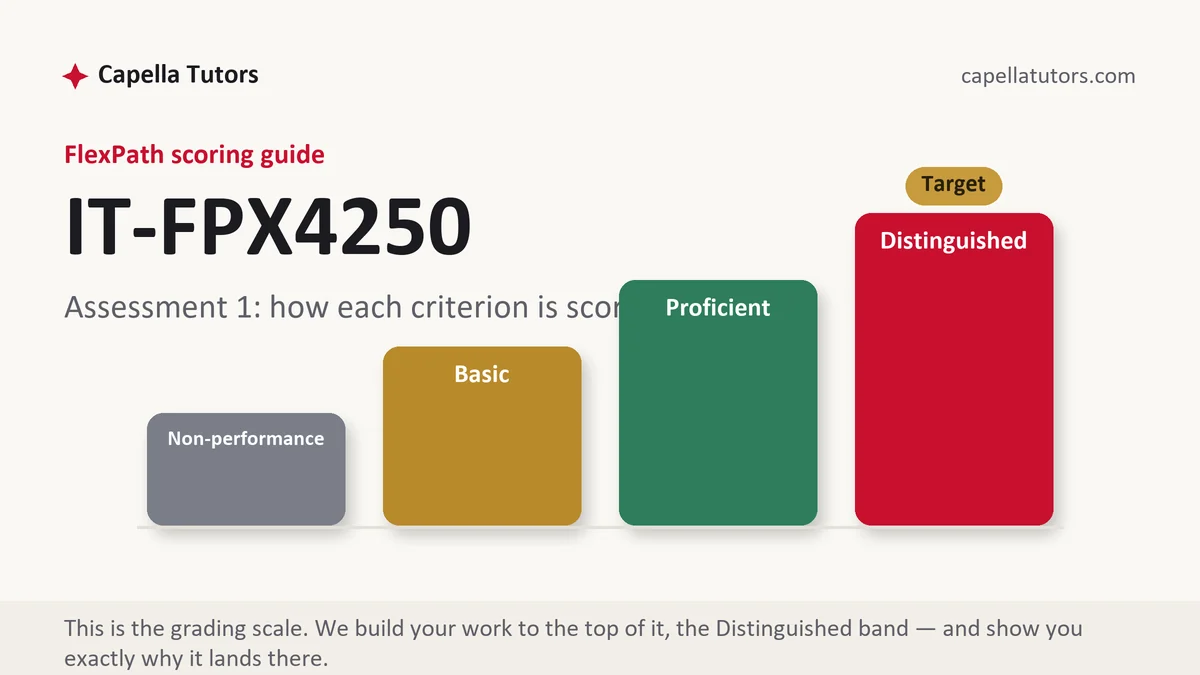
How IT FPX 4250 Assessment 1 is scored
FlexPath produces levels rather than scores. Each criterion is placed at one of four descriptions, and the one above your draft is a list of the work still outstanding:
| Level | What it means on a pipeline design |
|---|---|
| Distinguished | The decision is stated precisely enough that the analysis could fail to support it, the profile quantifies the defects, and every pipeline stage has a failure behavior and a recovery. Somewhere in each criterion sits one further move; go and make it. |
| Proficient | A coherent design with the stages named and the data described. Capable work in which the failure paths are still implied rather than written. |
| Basic | A diagram of boxes with arrows, a description of the dataset, and no decision anywhere that the work would change. |
| Non-performance | A required element is absent, most often the profiling results or the choice between batch and streaming. Absence decides its own row. |
Work backward rather than forward. What would have to be true for the decision to change, what measurement would establish that, what data produces the measurement, and only then what pipeline moves the data. A design built in that order has a reason for every component in it.
The IT FPX 4250 Assessment 1 method, step by step
-
Write the decision in one sentence before you open a file
Take a municipal transit agency deciding whether to move service from two low-ridership routes onto a third. The decision is that specific, and it names who will act on it. A question written as an area of interest instead of a decision produces a paper that explores attractively and recommends nothing, which is precisely the middle of this guide.
-
Profile the data and publish what you found
Missing rates by column, duplicate records, categories that are the same thing spelled two ways, and the time range the data actually covers rather than the range you were told. Fare-gate taps and vehicle-location records will disagree about time, granularity, and completeness, and reporting that disagreement before any analysis is the honest foundation every later claim rests on.
-
Decide batch or streaming and say why
These are separate designs answering separate questions. An agency reviewing service patterns each month does not need per-event processing, while a signal-priority decision at an intersection cannot wait for a nightly job. Name which one the scenario needs, and where the answer is both, say which parts are which rather than drawing one pipeline and hoping.
-
Land the raw data before anything transforms it
Keep an unmodified copy of what arrived, then transform into a curated layer, then serve a shaped layer to the people who will query it. Say what each layer is for, who can read it, and how long it is kept. A pipeline with no raw layer cannot answer the question every analyst eventually asks, which is whether the number changed because reality changed or because the transformation did.
-
Give every stage a failure behavior
For each step: what happens if it fails, whether a retry is safe, who is told, and how the run is resumed without double-counting. Late-arriving data deserves its own sentence, because a vehicle feed that delivers yesterday's records this morning quietly corrupts any total that was already published. This section is usually the difference between the top two levels.
-
Choose the storage arrangement with a reason, then self-score
Object storage, a warehouse, and a lakehouse arrangement solve different problems at different costs, and naming the one you chose with the reason attached is worth more than describing all three. Then mark every criterion D, P, B, or N against the guide, revise the rows that fall short, and upload early because an evaluation can take two business days.
A structure that maps to the criteria
The word counts are our tutors' planning shape for a design document of this kind rather than a Capella rule; tables and diagrams are additional.
| Section | What it must do | Guide |
|---|---|---|
| Decision and audience | The decision to be informed, who makes it, when they make it, and what would change their mind. | ~250 words |
| Data sources | Each source, its owner, its volume, its refresh rate, and how it arrives. | ~250 words |
| Profile | Missing rates, duplicates, inconsistent categories, and the real coverage window, all quantified. | ~300 words |
| Pipeline | Ingestion, raw landing, transformation, orchestration, and serving, with batch or streaming justified. | ~350 words |
| Failure handling | Per stage: failure behavior, retry safety, notification, resumption, and treatment of late data. | ~250 words |
| Storage choice and sources | The arrangement chosen with its reason, retention per layer, and provider documentation dated in current APA. | ~200 words |
Annotated sample excerpt
A short passage of original model text from our team, written at the level the top column describes. Take the way it quantifies before it claims.
The fare-gate extract covers 26 months rather than the 36 the request described, because the western district gates were replaced in the first quarter of the window and no records were retained from the previous units, which caps any year-over-year comparison at two years for that district.1 Route identifiers appear in three spellings across the two sources, with 4.1 percent of vehicle-location rows carrying a legacy code that no longer exists in the route table, and 0.6 percent of fare-gate rows carrying no route at all; both are resolved by a mapping table published with this design rather than by a quiet substitution inside the transformation.2 Vehicle-location records arrive at 30 second intervals while fare-gate taps are individual events, so any joined analysis is accurate to the location interval and not to the second, and the recommendation section states that limit rather than implying a precision the data cannot support.3
- 1Corrects the stated coverage with the real one and names the consequence for the analysis. Finding a discrepancy in your own inputs reads as competence, not as a setback.
- 2Quantifies two defects to a decimal place and puts the fix in the open. A published mapping table is reproducible; a substitution buried in a transformation is not.
- 3States the granularity limit that the join inherits, before anybody reports a number to the second. Naming the ceiling on precision is the move the top column pays for.
The full premium sample for your exact assessment, written fresh to your scoring guide and issue, is free to request. Study it, revise it into your own voice, and submit work you understand.
The five mistakes that cost Distinguished
- A question written as a topic. Understanding ridership patterns is an activity, and the criteria are asking which decision the work informs.
- Profiling replaced by a description. Saying the data is mostly complete earns nothing next to a missing rate by column.
- Batch and streaming used interchangeably. They answer different questions, and a design that never chooses has not made the decision being graded.
- No raw layer in the pipeline. Without an unmodified copy, nobody can tell whether a number moved because reality did or because the code did.
- Failure handling left as monitoring. A stage with no stated recovery is a stage that will be recovered by somebody guessing at three in the morning.
Pre-submission checklist
- One sentence names the decision, its owner, and what would change it
- Every source has an owner, a volume, a refresh rate, and an arrival mechanism
- Missing rates, duplicates, inconsistent categories, and the real coverage window are quantified
- Batch or streaming is chosen explicitly, with the reason stated
- Each stage has a failure behavior, retry safety, a notification, and a resumption path
- Late-arriving data is addressed, retention is stated per layer, and every row self-scored
Pipeline design due and the profile is missing?
Send the dataset description, the scenario, and the criteria. A premium original returns inside 24 to 48 hours with a decision worth making, a profile with numbers in it, and a pipeline whose every stage knows what to do when it fails. First sample free.